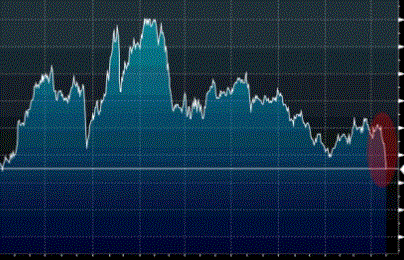
Puma Biotechnology Operating Margin vs. Profit Margin
| PBYI Stock | USD 6.07 0.17 2.88% |
Puma Biotechnology Operating Profit Margin | 0.16 |
| Current Value | Last Year | Change From Last Year | 10 Year Trend | ||||||
|---|---|---|---|---|---|---|---|---|---|
| Gross Profit Margin | 0.86 | 0.7453 |
|
|
This section tracks how Puma Biotechnology profitability aligns with revenue trends, asset use, and equity returns.
Puma Biotechnology's Segment Revenue Breakdown
Puma Biotechnology's revenue is distributed across 2 distinct product categories. Puma Biotechnology's revenue is anchored by Product (59.88 Million, 79.4%), followed by Royalty (15.57 Million, 20.6%). A single segment driving over 60% of revenue suggests limited product diversification, which can amplify both upside and downside.
Your Equity Center.
Macro event markers
Revenue Breakdown by Earning Segment for Puma Biotechnology Details
Puma Biotechnology's product-level revenue split is shown below, highlighting each segment's share of total revenue. At 20.6%, Royalty is the narrowest segment in Puma Biotechnology's product mix.
These estimates offer context for valuation and trend interpretation. They are presented as informational inputs alongside other fundamentals and timeframes.
Quarterly Earnings Growth -0.34 | Earnings Share 0.63 | Revenue Per Share | Quarterly Revenue Growth 0.277 | Return On Assets |
Market capitalization and book value offer complementary views of Puma Biotechnology - the first driven by investor sentiment, the second by accounting standards. Puma Biotechnology's market capitalization is 308.82 M. A P/B ratio of 2.37 indicates the market values Puma Biotechnology above its accounting book value. Enterprise value stands at 239.84 M. Value and price for Puma Biotechnology are related but not identical, and they can diverge across cycles. Trading price represents the transaction level agreed by market participants.
The concept of value for Puma Biotechnology differs from its quoted price, since each reflects a different lens. For Puma Biotechnology, key inputs include a P/E ratio of 18.52, a P/B ratio of 2.37, a profit margin of 13.62%, and ROE of 27.97%. The actual Puma Biotechnology transaction price is determined by real-time order flow on the exchange.
Puma Biotechnology Profit Margin vs. Operating Margin Fundamental Analysis
Sector-based pricing multiples position Puma Biotechnology within its competitive valuation range. Puma Biotechnology claims the number one ranking for operating margin among direct rivals. It places second for profit margin among direct rivals recording roughly 0.60 in Profit Margin for every unit of Operating Margin. Operating Margin outpaces Profit Margin by 1.66 times for Puma Biotechnology. Puma Biotechnology shows Operating Profit Margin decreasing by approximately 2.08% year over year. The most recent annual figure for Operating Profit Margin was 0.16. Valuation multiples such as P/E, P/B, and P/S compare Puma Biotechnology to peer earnings performance.Puma Profit Margin vs. Operating Margin
Operating Margin shows how much operating income a company makes on each dollar of sales. It is one of the profitability indicators which helps analysts to understand whether the firm is successful or not making money from everyday operations.
Puma Biotechnology |
| = | 0.23 % |
A good Operating Margin is required for a company to be able to pay for its fixed costs or payout its debt, which implies that the higher the margin, the better. This ratio is most effective in evaluating the earning potential of a company over time when comparing it against a firm's competitors.
Profit Margin measures overall efficiency of a company and shows its ability to withstand competition as well as defend against adverse conditions such as rising costs, falling prices, decline in sales or management distress. Profit margin tells investors how well the company executes on its overall pricing strategies as well as how effective the company in controlling its costs.
Puma Biotechnology |
| = | 0.14 % |
In a nutshell, Profit Margin indicator shows the amount of money the company makes from total sales or revenue. It can provide a good insight into companies in the same sector, as well as help to identify trends of a company from year to year.
Puma Profit Margin Comparison
Puma Biotechnology is currently under evaluation for profit margin among direct rivals.
Puma Biotechnology Profitability Projections
The most important aspect of a successful company is its ability to generate a profit. For investors in Puma Biotechnology, profitability is also one of the essential criteria for including it into their portfolios because, without profit, Puma Biotechnology will eventually generate negative long term returns. The profitability progress is the general direction of Puma Biotechnology's change in net profit over the period of time. It can combine multiple indicators of Puma Biotechnology, where stable trends show no significant progress. An accelerating trend is seen as positive, while a decreasing one is unfavorable. A rising trend means that profits are rising, and operational efficiency may be rising as well. A decreasing trend is a sign of poor performance and may indicate upcoming losses.
| Last Reported | Projected for Next Year | ||
| Accumulated Other Comprehensive Income | 36 K | 37.8 K | |
| Operating Income | 37.3 M | 39.2 M | |
| Income Before Tax | 35.8 M | 37.6 M | |
| Net Income | 31.1 M | 32.7 M | |
| Net Income From Continuing Ops | 31.1 M | 32.7 M | |
| Non Operating Income Net Other | -10.5 M | -10 M | |
| Total Other Income Expense Net | -1.5 M | -1.6 M | |
| Net Income Applicable To Common Shares | 2.3 K | 2.4 K | |
| Income Tax Expense | 4.7 M | 4.9 M | |
| Net Interest Income | -2.5 M | -2.7 M | |
| Interest Income | 4.1 M | 2.1 M | |
| Change To Netincome | 21.7 M | 20.6 M | |
| Net Income Per Share | 0.62 | 0.65 | |
| Income Quality | 1.34 | 1.41 | |
| Net Income Per E B T | 0.87 | 0.70 |
Puma Profitability Driver Comparison
Profitability drivers are factors that directly affect the investment outlook for Puma Biotechnology. Investors recognize that outcomes may not unfold as predicted, because unforeseen events and market disruptions can arise at any point and significantly alter the earnings trajectory.
Earnings Estimation Breakdown
The calculation of Puma Biotechnology's earnings per share is based on data from the past 12 consecutive months used for reporting the company's financial figures. The next projected EPS of Puma Biotechnology is estimated to be 0.07 with the future projection ranging from a low of 0.07 to a high of 0.07. Please be aware that this consensus of annual earnings estimates for Puma Biotechnology is based on EPS before non-recurring items.Last Reported EPS
0.07 Lowest | Expected EPS | 0.07 Highest |
Earnings Projection Consensus
A consensus EPS-based estimate above Puma Biotechnology's current price may suggest the market is pricing in excessive pessimism or overlooking near-term catalysts. Conversely, an estimate below market price could reflect a premium valuation that requires sustained earnings growth to justify. Both interpretations demand risk assessment and should not be acted upon in isolation.
| Number of Analysts | Historical Accuracy | Last Reported EPS | Estimated EPS for 30th of June 2026 | Current EPS (TTM) | |
| 1 | 45.4% | 0.0 | 0.07 | 0.63 |
Earnings per Share Projection vs Actual
When Puma Biotechnology reports actual EPS, investors compare it against the analyst consensus estimate for Puma Biotechnology to judge performance. A beat versus consensus is typically interpreted as positive execution; a miss signals a shortfall relative to expectations. EPS is expressed on a weighted average per-share basis to account for equity changes within the reporting period.Estimated Months Earnings per Share
EPS serves income investors in Puma Biotechnology as a quick gauge of dividend affordability: the higher the EPS relative to the dividend per share, the more cushion management has. However, accounting EPS can diverge from cash-based earnings, so investors should validate EPS signals with operating cash flow and capex data. Comparing Puma Biotechnology's EPS to sector peers provides further context for dividend sustainability.Quarterly Analyst Estimates and Surprise Metrics
Earnings surprise history for Puma Biotechnology's reveals whether the company tends to guide conservatively or struggles to meet analyst expectations. A pattern of consistent beats signals strong management execution; repeated misses may indicate structural challenges. Analyst EPS estimates are formed from a combination of forward guidance, sector trends, and macroeconomic inputs.
| Reported | Fiscal Date | Estimated EPS | Reported EPS | Surprise | |||
|---|---|---|---|---|---|---|---|
null | null | null | null | null | 0 | ||
2026-02-26 | 2025-12-31 | 0.27 | 0.29 | 0.02 | 7 | ||
2025-11-06 | 2025-09-30 | 0.16 | 0.21 | 0.05 | 31 | ||
2025-08-07 | 2025-06-30 | 0.09 | 0.12 | 0.03 | 33 | ||
2025-04-30 | 2025-03-31 | -0.22 | 0.1 | 0.32 | 145 | ||
2025-02-26 | 2024-12-31 | 0.14 | 0.43 | 0.29 | 207 | ||
2024-11-07 | 2024-09-30 | 0.35 | 0.41 | 0.06 | 17 | ||
2024-08-01 | 2024-06-30 | -0.13 | -0.09 | 0.04 | 30 | ||
2024-05-02 | 2024-03-31 | -0.22 | -0.1 | 0.12 | 54 | ||
2024-02-29 | 2023-12-31 | 0.3 | 0.26 | -0.04 | 13 | ||
2023-11-02 | 2023-09-30 | 0.08 | 0.12 | 0.04 | 50 | ||
2023-08-03 | 2023-06-30 | 0.01 | 0.05 | 0.04 | 400 | ||
2023-05-04 | 2023-03-31 | -0.07 | 0.03 | 0.1 | 142 | ||
2023-03-02 | 2022-12-31 | 0.01 | -0.12 | -0.13 | 1300 | ||
2022-11-03 | 2022-09-30 | -0.05 | -0.01 | 0.04 | 80 | ||
2022-08-04 | 2022-06-30 | 0.0102 | 0.21 | 0.1998 | 1958 | ||
2022-05-05 | 2022-03-31 | -0.17 | -0.08 | 0.09 | 52 | ||
2022-03-03 | 2021-12-31 | -0.09 | 0.1 | 0.19 | 211 | ||
2021-11-04 | 2021-09-30 | -0.31 | -0.9 | -0.59 | 190 | ||
2021-08-05 | 2021-06-30 | -0.27 | -0.13 | 0.14 | 51 | ||
2021-05-06 | 2021-03-31 | 0.09 | 0.4 | 0.31 | 344 | ||
2021-02-25 | 2020-12-31 | -0.31 | -0.38 | -0.07 | 22 | ||
2020-11-05 | 2020-09-30 | -0.39 | -0.79 | -0.4 | 102 | ||
2020-08-06 | 2020-06-30 | -0.3 | 0.08 | 0.38 | 126 | ||
2020-05-07 | 2020-03-31 | -0.77 | -0.43 | 0.34 | 44 | ||
2020-02-20 | 2019-12-31 | -0.48 | -0.29 | 0.19 | 39 | ||
2019-11-06 | 2019-09-30 | -0.71 | -0.44 | 0.27 | 38 | ||
2019-08-08 | 2019-06-30 | -0.95 | -0.97 | -0.02 | 2 | ||
2019-05-09 | 2019-03-31 | -0.68 | -0.26 | 0.42 | 61 | ||
2019-02-28 | 2018-12-31 | -0.77 | -0.8 | -0.03 | 3 | ||
2018-11-01 | 2018-09-30 | -0.97 | -0.37 | 0.6 | 61 | ||
2018-08-09 | 2018-06-30 | -1.26 | -1.17 | 0.09 | 7 | ||
2018-05-09 | 2018-03-31 | -1 | -0.65 | 0.35 | 35 | ||
2018-03-01 | 2017-12-31 | -1.97 | -1.71 | 0.26 | 13 | ||
2017-11-09 | 2017-09-30 | -2.58 | -2.07 | 0.51 | 19 | ||
2017-08-09 | 2017-06-30 | -2.04 | -2.1 | -0.06 | 2 | ||
2017-05-10 | 2017-03-31 | -1.98 | -1.97 | 0.01 | 0 | ||
2017-03-01 | 2016-12-31 | -1.92 | -2.04 | -0.12 | 6 | ||
2016-11-09 | 2016-09-30 | -1.96 | -2.02 | -0.06 | 3 | ||
2016-08-09 | 2016-06-30 | -2.18 | -2.05 | 0.13 | 5 | ||
2016-05-10 | 2016-03-31 | -1.99 | -2.19 | -0.2 | 10 | ||
2016-02-29 | 2015-12-31 | -1.95 | -1.9 | 0.05 | 2 | ||
2015-11-09 | 2015-09-30 | -1.84 | -1.87 | -0.03 | 1 | ||
2015-08-10 | 2015-06-30 | -1.55 | -2.01 | -0.46 | 29 | ||
2015-05-11 | 2015-03-31 | -1.35 | -1.66 | -0.31 | 22 | ||
2015-03-02 | 2014-12-31 | -1.19 | -1.57 | -0.38 | 31 | ||
2014-11-10 | 2014-09-30 | -1.21 | -1.19 | 0.02 | 1 | ||
2014-08-11 | 2014-06-30 | -0.66 | -1.29 | -0.63 | 95 | ||
2014-05-12 | 2014-03-31 | -0.48 | -0.67 | -0.19 | 39 | ||
2014-03-03 | 2013-12-31 | -0.49 | -0.56 | -0.07 | 14 | ||
2013-11-12 | 2013-09-30 | -0.46 | -0.5 | -0.04 | 8 | ||
2013-08-06 | 2013-06-30 | -0.43 | -0.44 | -0.01 | 2 | ||
2013-05-09 | 2013-03-31 | -0.63 | -0.41 | 0.22 | 34 | ||
2013-03-31 | 2012-12-31 | -0.75 | -0.83 | -0.08 | 10 | ||
2012-11-14 | 2012-09-30 | -0.52 | -1.29 | -0.77 | 148 | ||
2012-08-14 | 2012-06-30 | -0.35 | -0.22 | 0.13 | 37 | ||
2012-05-15 | 2012-03-31 | -0.25 | -0.57 | -0.32 | 128 |
Use Puma Biotechnology in pair-trading
Pair trading with Puma Biotechnology can help investors hedge some company-specific exposure by balancing a long view with an offsetting position. The key question is whether the second leg adds real hedge value instead of just creating a more complex version of the same risk.
Puma Biotechnology Pair Trading
Puma Biotechnology Pair Trading Analysis
The ability to find closely correlated positions to Puma Biotechnology could be a great tool in your tax-loss harvesting strategies, allowing investors a quick way to find a similar-enough asset to replace Puma Biotechnology when you sell it.
The correlation of Puma Biotechnology is a statistical measure of how it moves in relation to other instruments. This measure is expressed in what is known as the correlation coefficient, which ranges between -1 and +1.
Correlation analysis and pair evaluation for Puma Biotechnology can support hedging context. This approach is commonly reviewed within sectors and across broader groups.Use Investing Themes to Complement your Puma Biotechnology position
With 308.82 Million market cap in the Biotechnology industry, Puma Biotechnology works well as a smaller-cap core holding around which broader thematic baskets can be built. Anchoring a Biotechnology theme around Puma Biotechnology at 308.82 Million can be tuned for upside participation or tighter downside control depending on Healthcare outlook.
Did You Try This Idea?
Run Market Neutral Funds Thematic Idea Now
Market Neutral Funds
Funds or Etfs that invest in both long and short positions of different entities to enhance returns from broad market movements over time. The Market Neutral Funds theme has 38 constituents at this time.
The Market Neutral Funds Theme can be deployed as a buy-and-hold allocation or traded actively around individual position volatility.
| View All Next | Launch |
More Resources for Puma Stock Analysis
Reviewing Puma Biotechnology commonly begins with financial statements and performance trends. Ratios and trend metrics help frame Puma Biotechnology's operating context across reporting periods. Key reports that frame Puma Biotechnology Stock are listed below:Your Equity Center. For information on how to trade Puma Stock refer to our How to Trade Puma Stock guide.Puma Biotechnology P/E of 18.52 alongside ROE at 27.97% frames the starting point - the resources below add portfolio-level context that single-security analysis cannot provide alone. That valuation within Healthcare invites comparison with Biotechnology peers using the tools below to judge whether the multiple is justified. You can also try the Companies Directory module to evaluate performance of over 100,000 Stocks, Funds, and ETFs against different fundamentals.
Projecting Puma Biotechnology's profitability starts with historical financial statements. The core view includes income statement, balance sheet, and cash flow.